Events
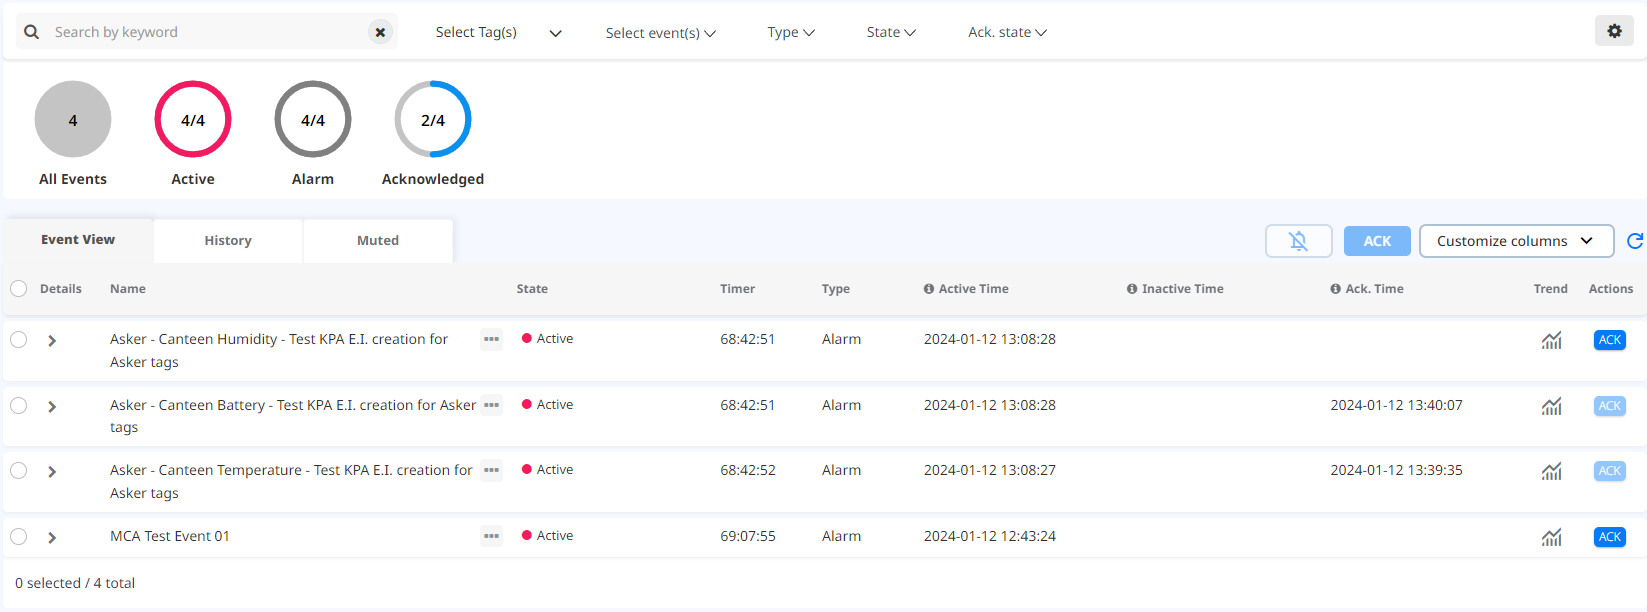
The “Events” page shows the current status and history of Event Instances. The event lists can be filtered to display events in several different ways.
The “Event View” tab lists the currently active Events, and inactive Events that have not been acknowledged.
The “History” tab lists all Events that are both inactive and acknowledged or archived. The “Muted” tab lists all Events that are muted on a certain period.
The Event Definitions can be edited for each instance, and the Logs containing all the changes the event states pass through can be accessed.
Types of Events
There are two Event Types defined in the system: Alarm and Other.
The functional flow for the Alarm type of Events is:
An Event Instance (Alarm) is Created and assigned a Creation Date.
If there is a Grace Period defined in the Event Definition, the Event Instance is Activated after the Grace Period expires. If no Grace Period is defined, it is activated immediately.
If the new evaluation does not meet the Alarm Condition, the Alarm is Inactivated if it is not in a Grace Period (Inactive Date). If it is in a Grace Period it is Archived.
Both active and inactive Event Instances can be Acknowledged by a Recipient.
Both active and inactive Event Instances can be Muted.
Every time a Condition is met, before the creation of an Event Instance, system finds the old inactive Alarm for the Event Definition (acknowledged or not) and archives it .
Event Definitions can be edited or deleted. In this case its instances are Archived.
The functional flow for the Other type of Events is:
An Event Instance is Created.
If there is a Grace Period defined in the Event Definition, the Event Instance is Activated after the Grace Period expires. If no Grace Period is defined, it is activated immediately.
If the new evaluation does not meet the Condition, the Event Instance are Archived.
Event Definition can be edited or deleted. In this case its instances are Archived.
Columns
Columns common for all Event Types are:
| Column Name | Value |
|---|---|
| State | Active or Inactive |
| Timer | Time elapsed since Activation |
| Type | Alarm or Other |
| Creation Time | Timestamp for creation |
| Active Time | Timestamp for transition to Active state |
| Inactive Time | Timestamp for transition to Inactive state |
| Ack Time | Timestamp for Acknowledgement of Alarm |
| Trend | Link to trend view |
| Actions | Button for Acknowledging Alarm |
You should select which columns you want to see in the table using the button  The “Details”, “Name” and “Actions” are default columns and cannot be hidden.
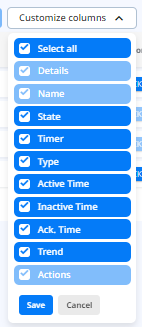
Note: This option is possible in ”Event View”, “History” and “Muted” tabs in the “Events view”.
Filters
The following filters are available for both Events and History tabs:
- “TAGS FILTER” - the tags tree view filter is populated with the Tags and their Assets for which the user has asset scopes. It filters Event Instances for selected Tags.
- “SEARCH FILTER” (by name) - filters the Event Instances with a name that contains the search string.
- “EVENT TYPE” - filters only the Event Instances from selected Event Type.
- “IN GRACE PERIOD” - If checked, only Event Instances that are in Grace Period will be displayed .
In the Events tab there are also:
- “EVENT STATE” - filters the Event Instances that have the selected event state.
- “ACKNOWLEDGED STATE” - filters the Event Instances that have the selected acknowledged state.

In the History tab there are also:
- “TIME PERIOD FILTER” - filters the Event Instances by creation date.

Depending on what is selected in the filters, you can have a different columns displayed: Column is not displayed if its data is not expected for a certain filter combination.
Info in columns
If the Event Definition contains many Tags, then the name displayed for the Event Instances consists of the Tags’ names separated by dashes ("-")
If data is not expected, “-” is displayed.
If data is expected but not available, an empty cell is displayed.
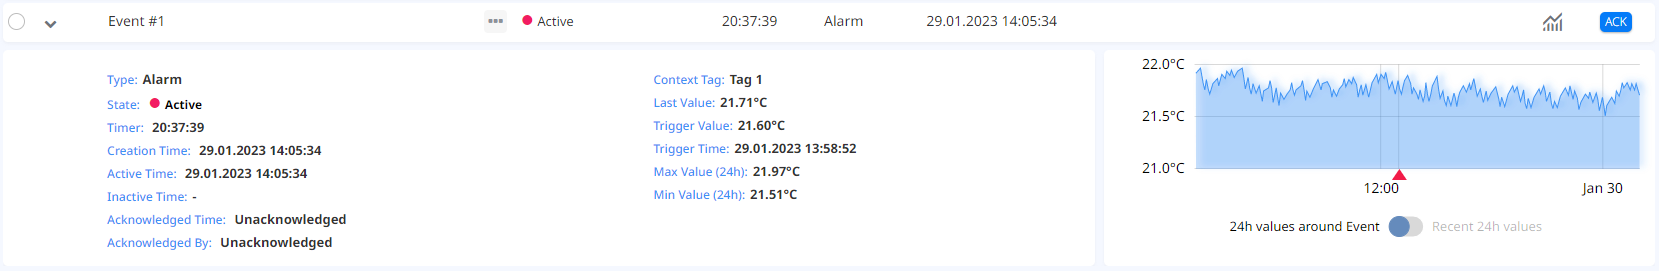
Event details
Details, including event action time and other numerical information, are provided for all Event Instances in the “Event View”. Clicking the arrow at the beginning of each row expands the row to show all associated Event Details. If data is not expected, the label for a certain time is not displayed. If data is expected but not available, “-” is displayed. The event details chart visualizes the moment when the event take places according to the data provided from the tag. By toggling the switch, the chart displays the data points surrounding the event or the recent 24 hour data points.
Sorting
Clicking on a column header will sort the table data by the selected column.
Editing Event Instances
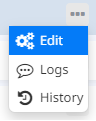
Events listed in the Event view tab can be edited by clicking “Edit” in the row context menu. This will take the user to the Event Configuration page and open the specific Event Definition for editing.
Logs
Events listed in both Event view and History tab have Logs. They can be reached by clicking “Logs” the row context menu. 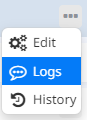
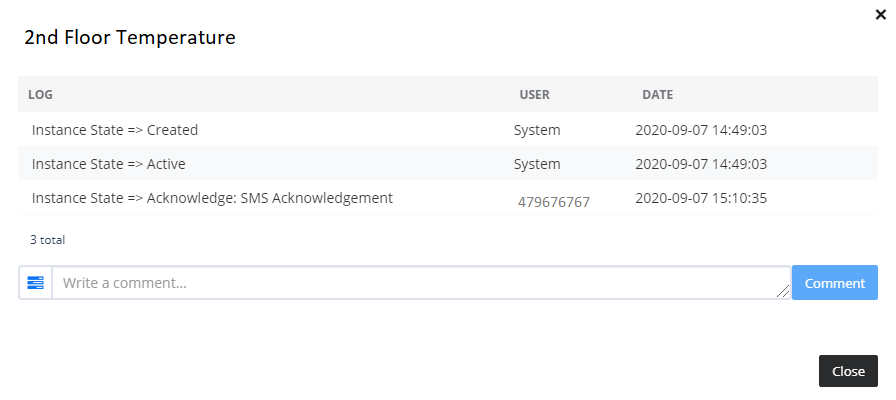
The Log for each instance contains information on changes in the State of the event, which User initiated the change, and at what time the change occured.There is also a possibility for the User to add a custom log in the form of a comment.
History
Events listed in Event view tab have History preview where you can see archived event instances. All archived data related to the chosen event can be reached by clicking “History” in the row context menu. 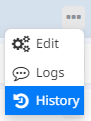
Event view Actions
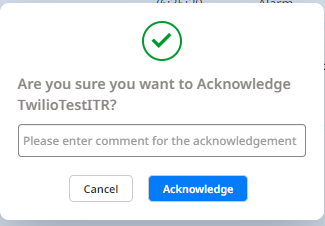
Event view events can be acknowledged by clicking the “ACK” button for the Event Instance row. A popup appears and you can confirm or cancel the acknowledgement.  . Multiple events instances can be acknowledged by selecting them using the available check box which enables the
  button to execute the bulk acknowledgement. In this case, the message written in the acknowledge popup will be logged for the multiple selected event instances.
Event view Links
Events are related to Tags which data can be visually presented in a chart in Trend view. Link to this page is available in “Trend” column of the “Event view” tab. 
Muted events
Muting events allows you to temporarily disable notifications for specific events and specific time period. Once the mute period expires, notifications will resume.
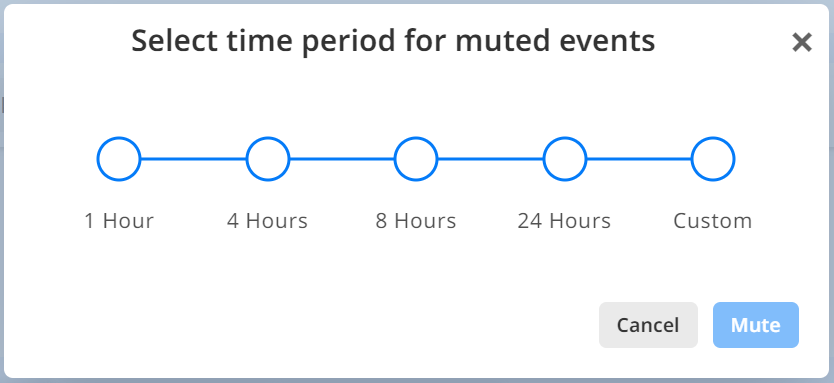
Event view events (active or inactive) can be muted by selecting event(s) and clicking the Mute button  . When you click on the Mute button, pop-up opens up where you can choose a predefined time period until when the selected event should be muted or choose a custom time period (Fig 7).
Muted events can be seen in the Muted tab, where you can see until when the events are muted and also Unmute them manually. If you want to unmute them manually you can select the event(s) and then click on the Unmute button  .
.