Asset Model
Asset Model is a platform that enables the creation of twin graphs based on digital models of entire environments, which could be markets, buildings, factories, farms, energy networks, railways, stadiums, and more—even entire cities. These digital models can be used to gain insights that drive better products, optimized operations, reduced costs, and breakthrough customer experiences.
Overview
Asset Model can be used to design a digital twin architecture that represents actual IoT devices, and which connects to IoT Hub device twins to send and receive live data. Take advantage of your domain expertise on top of Asset Model to build customized, connected solutions that:
- You can model your environment and bring asset twins to life in a scalable and secure manner
- You can Connect assets such as IoT devices
- With uses of Asset Model, you can connect your business logic and data processing
A sample architecture of a complete solution using Asset Model may contain the following components:
- This service stores your twin models and your twin graph with its state.
- With Asset Model instance you can configure models, create topology, and extract insights from the twin graph.
- One or more external compute resources to process events generated by Asset Model or connected data sources such as devices.
Functionalities
The Assets Page provides a flexible and organized asset model for visualizing your graphs. Every node’s data can be displayed in the JSON editor, where users can see all the properties and their values. Also, users can preview the models, add new Assets, export the graph, manipulate with the graph and add new custom properties.
Model
Models menu by default is hidden. In order to view Models, click this button  in the top left corner. In order to hide the Models click again on the same button.
Download Models
User can download all models provided (Asset and Tag models), in JSON file, by clicking  Download models button.
Create Asset
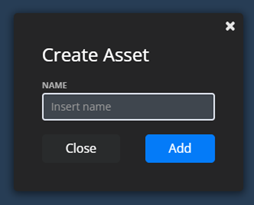
User can create new asset by clicking  Create an asset button. After click, a popup form appears. ‘Name’ is a required field. After clicking Add, the newly created Asset will be displayed in the graph.
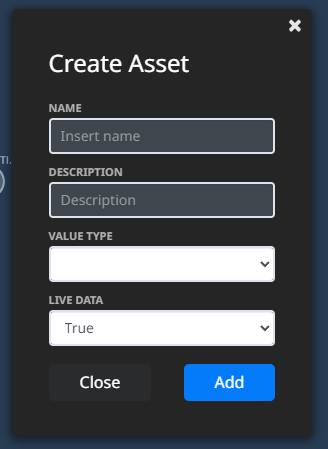
Create Virtual Tag
User can create new Virtual Tag by clicking Create a virtual tag button. After click, a popup form appears. ‘Name’, ‘Description’ and ‘Value Type’ are required fields. After clicking Add, the newly created Virtual Tag will be displayed in the graph and stored as other tags.
The value for the Virtual tags can be set with the ‘Set Tag Value’ widget from Dashboard.
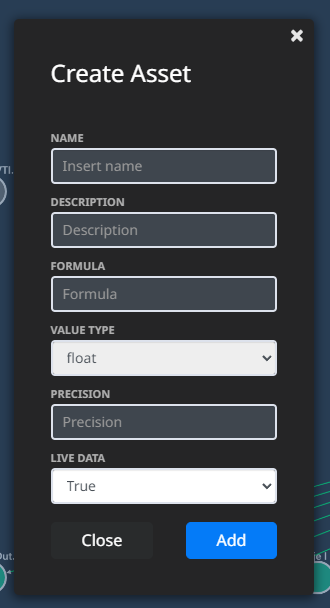
Create Calculated Tag
User can create new Calculated Tag by clicking Create a calculated tag button. After click, a popup form appears. ‘Name’, ‘Description’, ‘Formula’ and ‘Value Type’ are required fields. For now, user should add only float type of calculated tags, and for float tags ‘Precision’ is required field. After clicking Add, the newly created Calculated tag will be displayed in the graph and stored as other tags.
The property ‘Formula’ is the place where the user should add some mathematical operations between tags. For now, the value from the tags will be used by their ‘tagId’ together with the mathematical operations that user needs. The value for the Calculated Tag will be calculated according to the formula.
Note: Formula example:(“tagId” + 7 - “tagId1” - 3).
View Model
User can preview model in JSON format by clicking View Model button  .
.
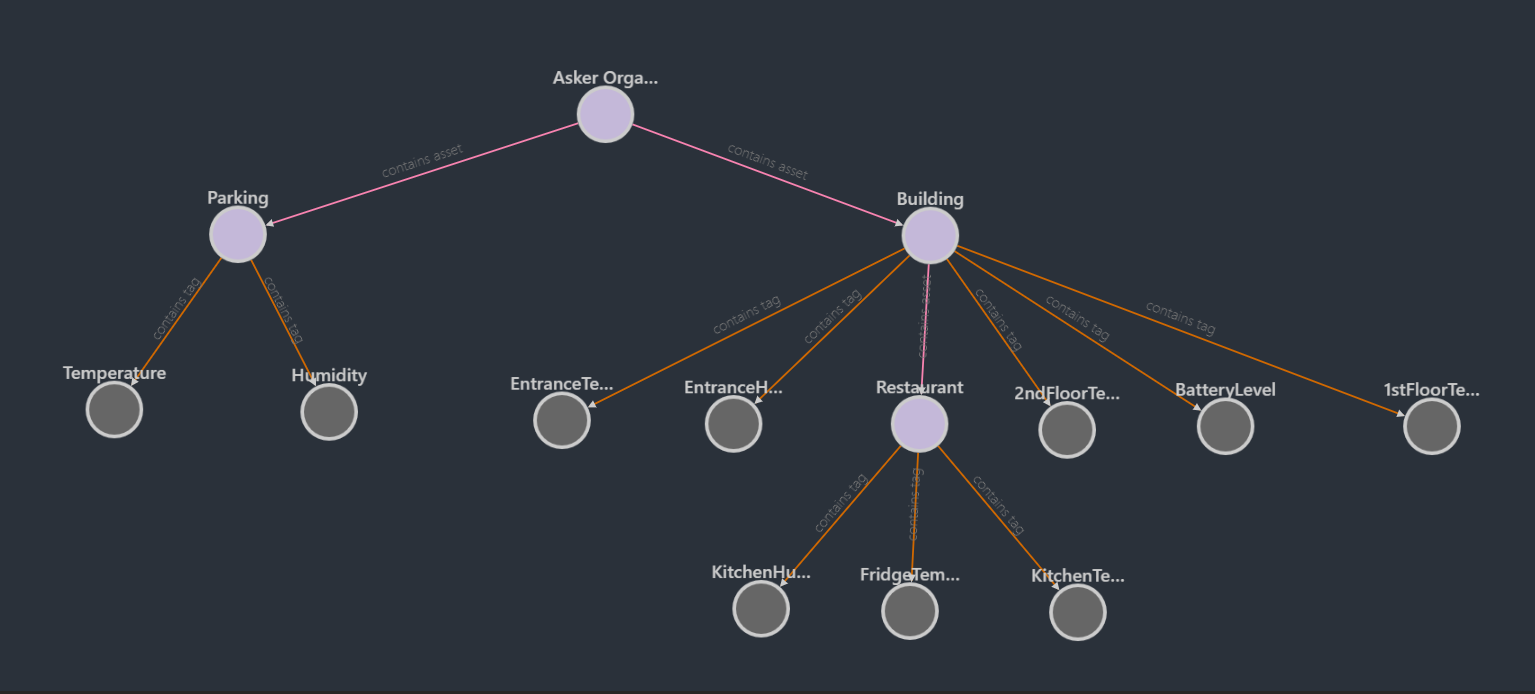
Asset Graph
In the Asset Graph are displayed all Assets and Tags with their relations. Assets and Tags nodes are displayed with different colors, to be distinct. Relations are also displayed with two colors, because there are two different types of relations, contains asset and contains tag.
Options for the whole graph
User can Zoom in, Zoom out, Zoom to Fit, Center and Filter the graph, by clicking these buttons placed in the bottom left corner of the Assets page.

Users can export the graph in JSON file by clicking the Export Graph button  placed on the top of the page.
Users can view the whole graph, if some of the nodes or relations are hidden previously, by clicking the View All button
placed on the top of the page.
Users can view the whole graph, if some of the nodes or relations are hidden previously, by clicking the View All button  placed on the top of the page. In order to see the hidden relations from the graph you should click on the Show All Relationships button
  .
.
Layouts
Layouts provide a mechanism for automatically positioning nodes in a graph. Default layouts include Cola, Dagre, fCoSE and Klay. User can choose preferred layout from the drop-down menu.
Context menu
In the graph there are context menus around nodes, which can be displayed by selecting some node and right click on the node or just right click on the node, after that the context menu with filters and actions is displayed. Actions options are only available if you have selected the node and then right clicked on it.
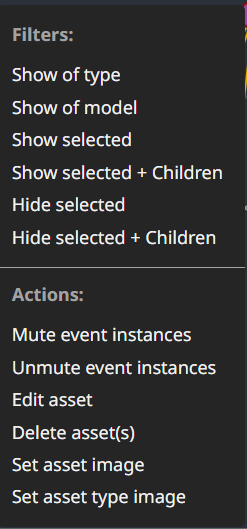
In the asset context menu, there are several options for Filters and Actions.
Filters
In the Filtering options if user clicks on Show of type, it will filter all nodes with the same type as the selected one. By clicking Show of model, it will filter all nodes with the same model as the selected one. By clicking Show selected it will show only the selected node and hide all other nodes. By clicking Show selected + Children it will filter only the selected node(s) and nodes below selected node(s). By clicking Hide selected it will hide the selected node(s) and its relationship(s) (if it has one). By clicking Hide selected + Children it will hide the selected nodes(s), all the nodes below them and their relationships.
Actions
Edit Asset
By clicking Edit asset action opens the editor on the right side of the screen.
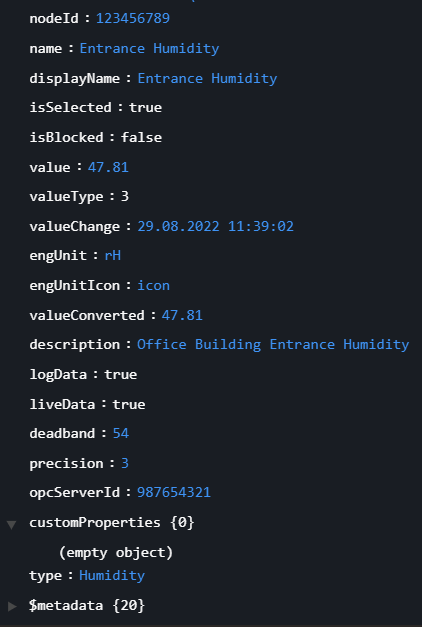
In the editor, for the selected asset or tag, are displayed all properties and their latest values.
User can edit only the displayName, name, description and type properties of the selected tag or asset. In order to save the changes, user should click Save Asset button  .
.
Delete Asset(s)
By clicking Delete asset(s), confirmation pop-up is displayed, after clicking Yes selected Asset(s) and its relationships will be deleted and the graph will be updated. Note: Delete asset(s) action is only available for Asset nodes.
Relationship context menu
Filters
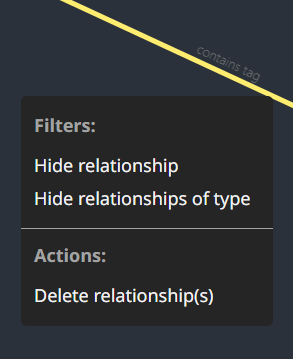
By clicking Hide relationship it will hide the selected relationship. By clicking Hide relationships of type it will hide all the relationships of the same type as the selected one.
Delete Relationship(s)
In order to delete relationship(s) you should click on the Delete relationship(s) option from the context menu. In order to delete multiple relationships at once you should select them by pressing Ctrl + Left click and select all the desired relationships. After deleting relationship(s) the graph will be updated. Delete relationship(s) option is only available if you have selected a relationship and then right clicked on it.
Add Relationships
In order to add relationship between nodes, at first you should select the parent node, than press Ctrl, than select the child node and then Right click on the child node. After that the context menu will be displayed:
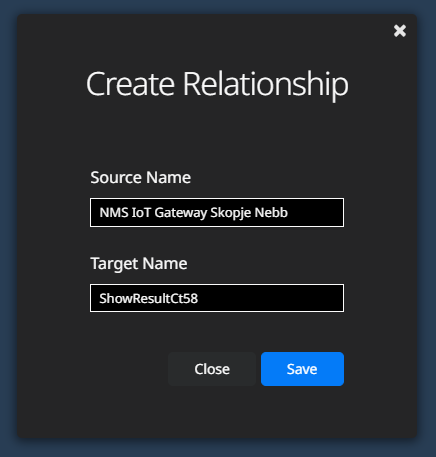
In the Create relationship modal there is information about the Source Name and Target Name. The relationship type will be added respectively by tag type. After clicking Save the graph will be updated.
Note: Add relationships action is only available when user wants to add relationship between Asset -> Asset, Asset -> Tag, Asset -> Virtual Tag and Asset -> Calculated Tag.
Editor
Editor by default is hidden. In order to open it you should select some node and click Edit asset. In order to close it, you should click this button  .
.
Add properties
In order to add some custom property to some Asset or Tag, you should click Add properties  .
.
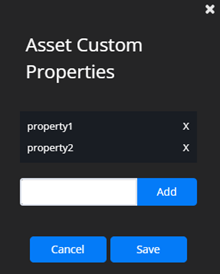
In the pop-up modal you should enter the name of the new property and then click Add. Newly added properties are displayed above the field, and they can also be removed. After clicking Save, the newly created properties will be displayed in the editor and then you should click  in order to save the Asset or Tag with the new properties.
Filter/Highlight the graph
The first option for filtering the graph is explained in the Context menu part.
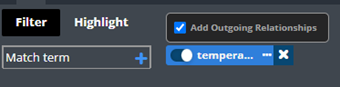
The second option for filtering the graph is by clicking Filter/Highlight button  .
In the Filter and Highlight sub-menus there is a field in which users can add terms to filter/highlight the graph. Terms can be removed or disabled by clicking the toggle button. Filtering will display only those nodes where there is a matching term and highlighting will highlight the matching nodes. The option Add Outgoing Relationships is selected by default, in order to deselect it you should click on the and the pop-up will be displayed.
.
In the Filter and Highlight sub-menus there is a field in which users can add terms to filter/highlight the graph. Terms can be removed or disabled by clicking the toggle button. Filtering will display only those nodes where there is a matching term and highlighting will highlight the matching nodes. The option Add Outgoing Relationships is selected by default, in order to deselect it you should click on the and the pop-up will be displayed.
Asset images
- Set model image - User can upload model image by clicking Upload image button
 . User can upload an image for Asset or Tag and the main nodes will be replaced with the uploaded image. When uploading image for model it will reflect in all nodes from the same model (Asset or Tag).
 - Set asset image - In order to set an image for only one node, user should select the node, right click on the node and select the ‘Set asset image’ option from the Actions list.
- Set asset type image - In order to set an image for nodes with the same ’type’ property, user should select a node with that ’type’ property, right click on the node and select the ‘Set asset type image’ option from the Actions list. This option is only available if the asset has value for ’type’ property.
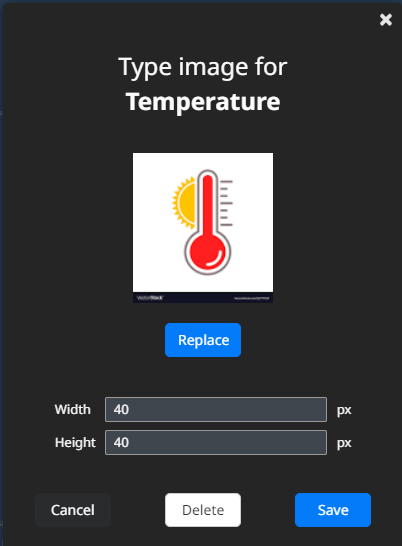
After uploading image, pop-up is opened (shown on Fig 11). User can choose Width and Height (min 20, max 200 pixels) for the selected image and then save the image by clicking the Save button  .
.
- Replace image - In order to replace existing image, user should choose Set model image/Set asset image/Set asset type image and then pop-up is opened. User should click on the Replace button
 , choose new image and then click Save button. In order to cancel the action, user should click Cancel
  .
. - Delete image - In order to delete existing image, user should open the set image pop-up and then click on the Delete button
 .
.
Mute event instances
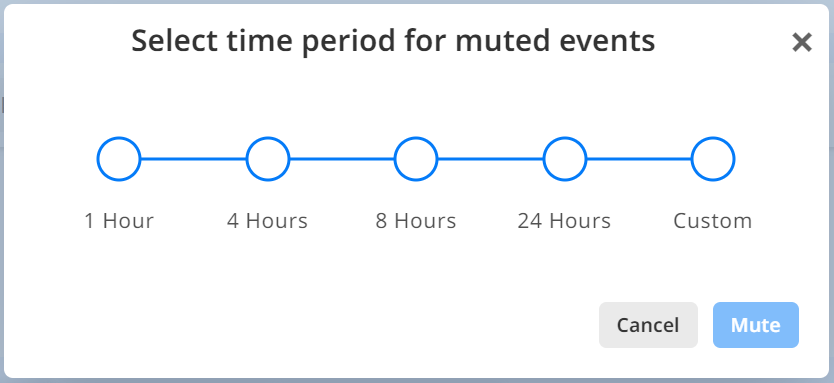
This option allows the user to mute one or multiple event instances via asset nodes. By clicking on “Mute event instances” option, a modal window containing the event instances that are related to that asset will be displayed.
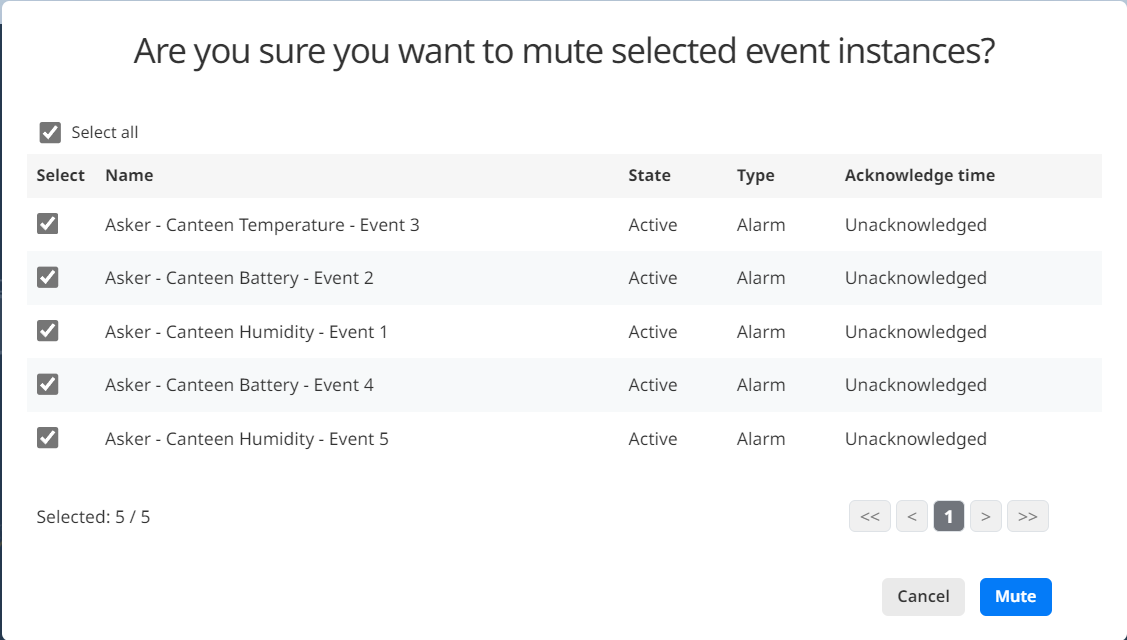
By default, all the event instances will be preselected. The user can unselect the event instances which he do not want to mute. Once the preferred event instances are selected, click on the “Mute” button. This will open a pop-up window where the user can choose a predefined time period until when the selected event instances should be muted or choose a custom time period.
Unmute event instances
This option allows the user to unmute one or multiple event instances via asset nodes. By clicking on “Unmute event instances” option, a modal window containing the event instances that were previously muted and are related to that asset will be displayed.
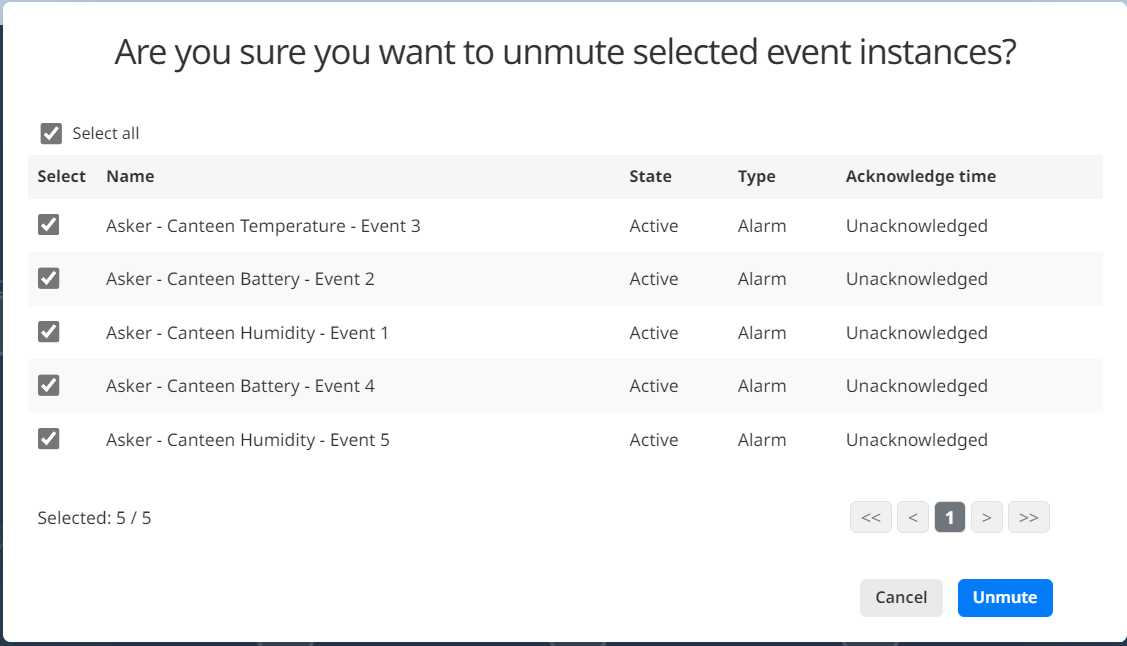
By default, all the event instances will be preselected. The user can unselect the event instances they do not want to unmute. Once the preferred event instances are selected, click on the “Unmute” button.