Endpoints
The Endpoints configuration page contains all of the accessible Endpoints and their associated nodes. An Endpoint is a logical representation of OPC server in the context of Qlarm environment, providing necessary data to manage an OPC server. Endpoints are the starting point of the main functional flow in the system, the messaging flow. All properties of an Endpoint should be configured to respond to the necessity of the flow. Starting from configuration of the Endpoint (its OPC server with Tags associated) via Event Definitions to Events raised and Notifications send to Recipients, Endpoints are the main trade for all of these entities.
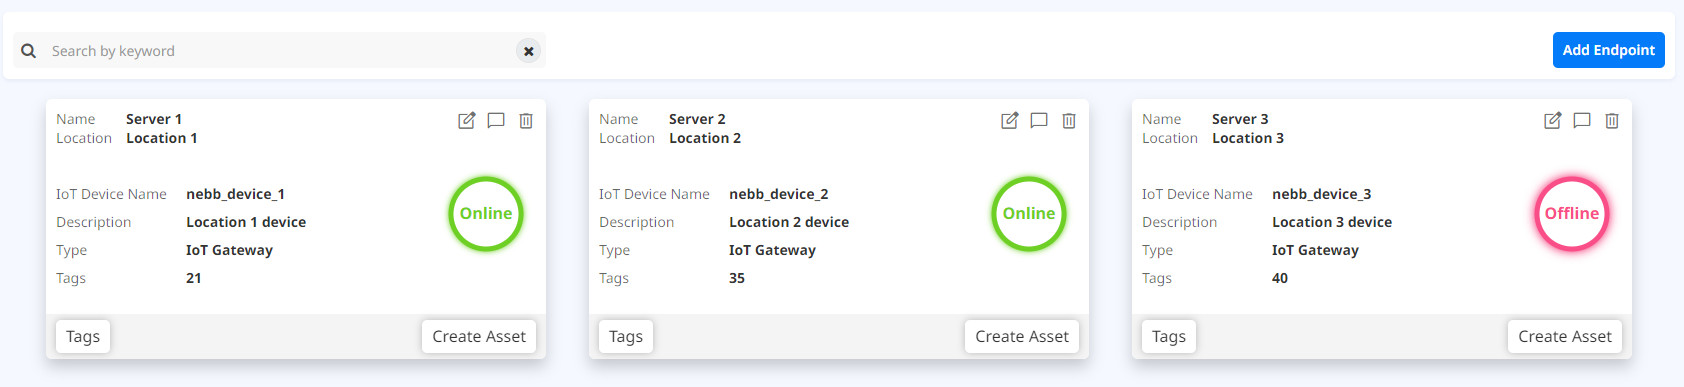
Upon opening the Endpoints configuration the User is greeted with a list of the accessible Endpoints which can be filtered by entering a keyword in the Search Filter.
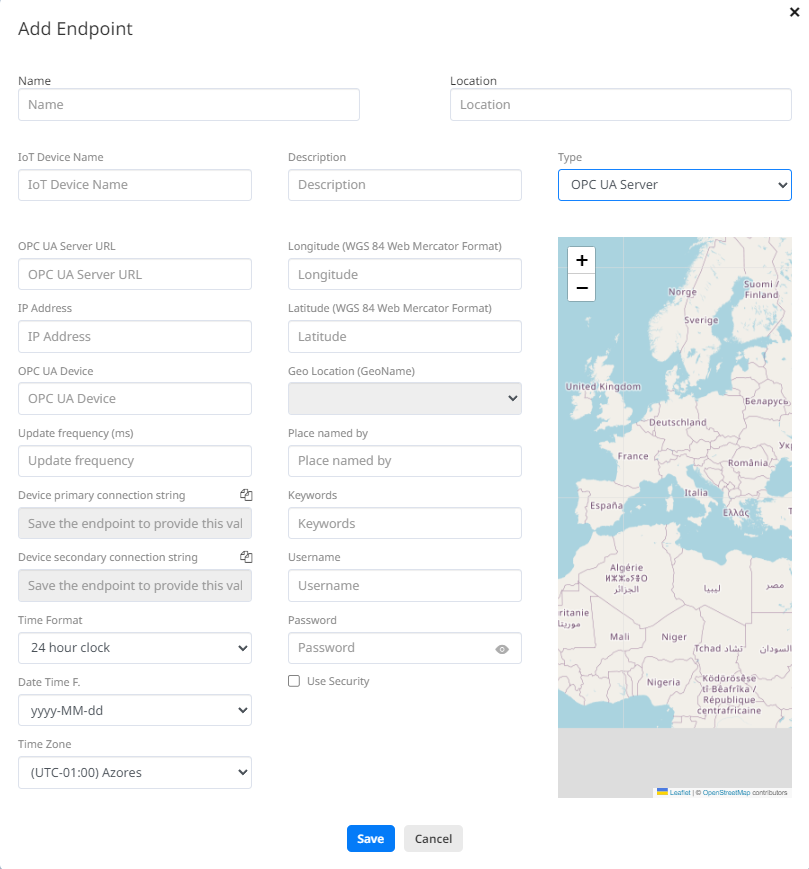
Each Endpoint is displayed with basic information: Name, Location, Status; and additional information: IoT Device Name, Description, Type, and Number of Tags. Type shows the type of the Endpoint (IoT Gateway or OPC UA Server). IoT Device Name and Descriptions may contain additional naming information for the specific Endpoint. Most of these information can be edited by clicking the  button, separately for each Endpoint. You can edit Name, Location, IoT Device Name and Description. Additionally, in this mode there is more information about a specific Endpoint: Update frequency (ms), Device primary connection string, Device secondary connection string, Date Time Format, Time Format, Time Zone, Longitude, Latitude, Geo Location (GeoName), Place named by (Nominatim), Keywords. If OPC UA Server Type is selected you can set OPC UA Server URL, IP Address and OPC UA Device info. IoT Device Name is the name of the device from the IoT Hub. Device primary connection string and Device secondary connection string are the connection strings for the IoT Device which is created when the Endpoint is created and you can expect these fields to be populated after the Endpoint is created. You can easily copy them and use them for your needs. This name is unique and is always prefixed with the low key tenant name and underscore. The Time Zone shows the time zone in which the Endpoint operates. Longitude, Latitude, Geo Location (GeoName), Place named by (Nominatim) can be easily populated by choosing a place on the map or inserting Longitude and Latitude. They provide additional info for endpoint location. For OPC UA Server type an installation package can be downloaded right after the Endpoint is created on click on the “Download” button in the header of the Endpoint panel
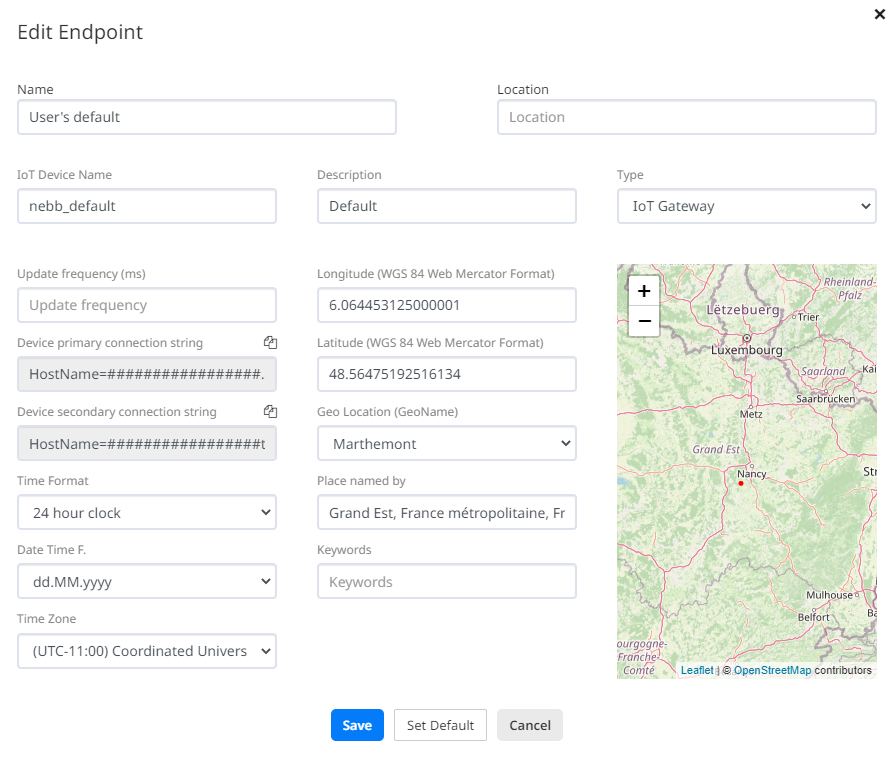
  . You can also set the specific Endpoint to be the Default endpoint which will enable every information associated with it to appear first in any table content. When a specific Endpoint is not set as default the “Set Default” button is
  , otherwise it is
  .
.
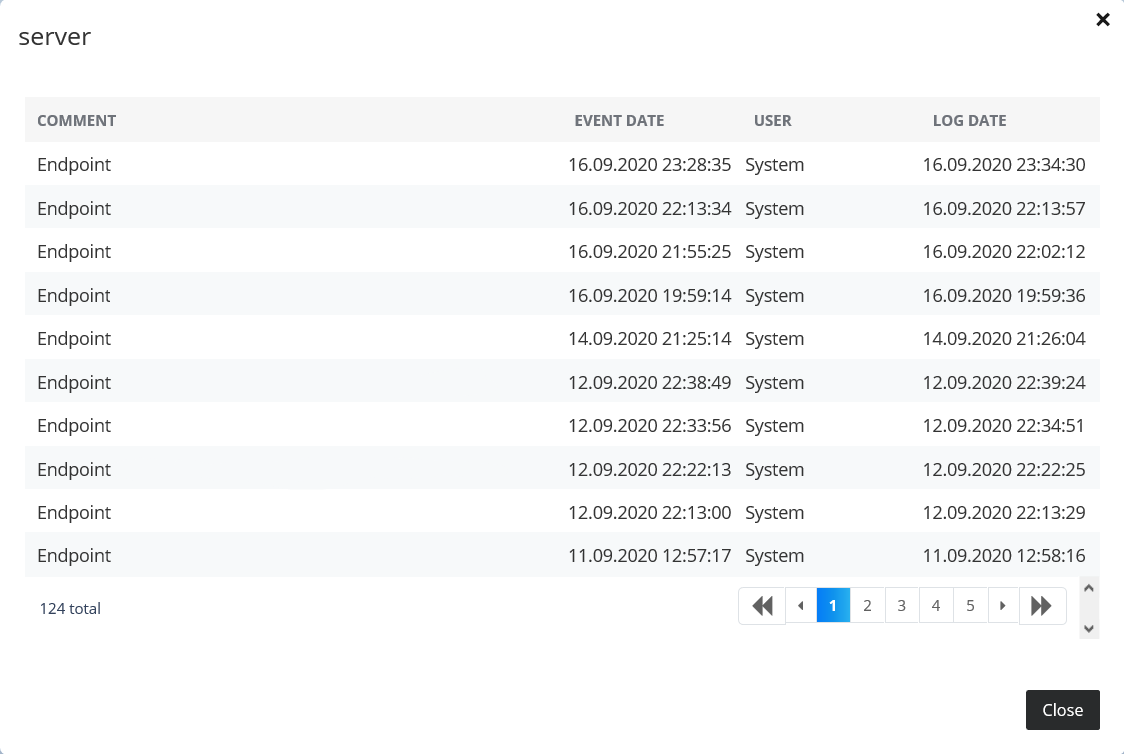
![]() contains the Logs for any changes associated with the specific Endpoint.
contains the Logs for any changes associated with the specific Endpoint.
The Status Label displays if the Endpoint is  or
or  .
.
Create asset button  enables creating an asset for the chosen endpoint and its tags, which will be visible in the Assets page in shape of a graph after its creation.
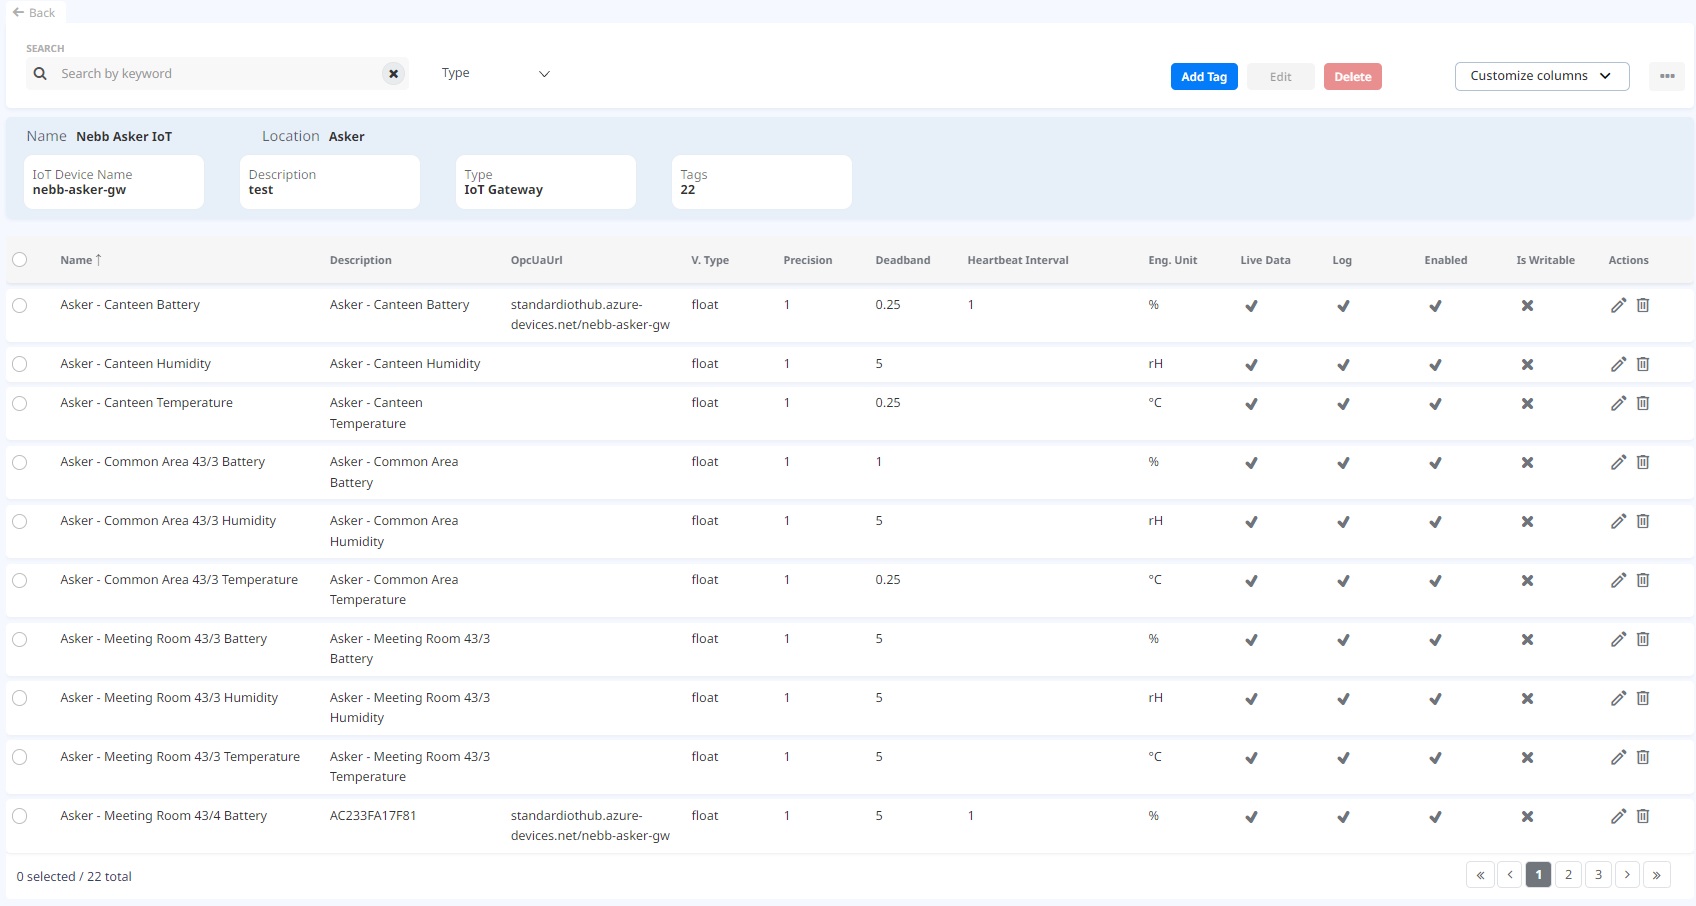
By clicking the  button the User can view the table of associated Tags for that endpoint. For each known Tag the table displays its Name, Description, OPC UA URL, Value Type, Precision, Deadband, Unit, Enable Live Data, Logs, Enable Status and Is Writable information.
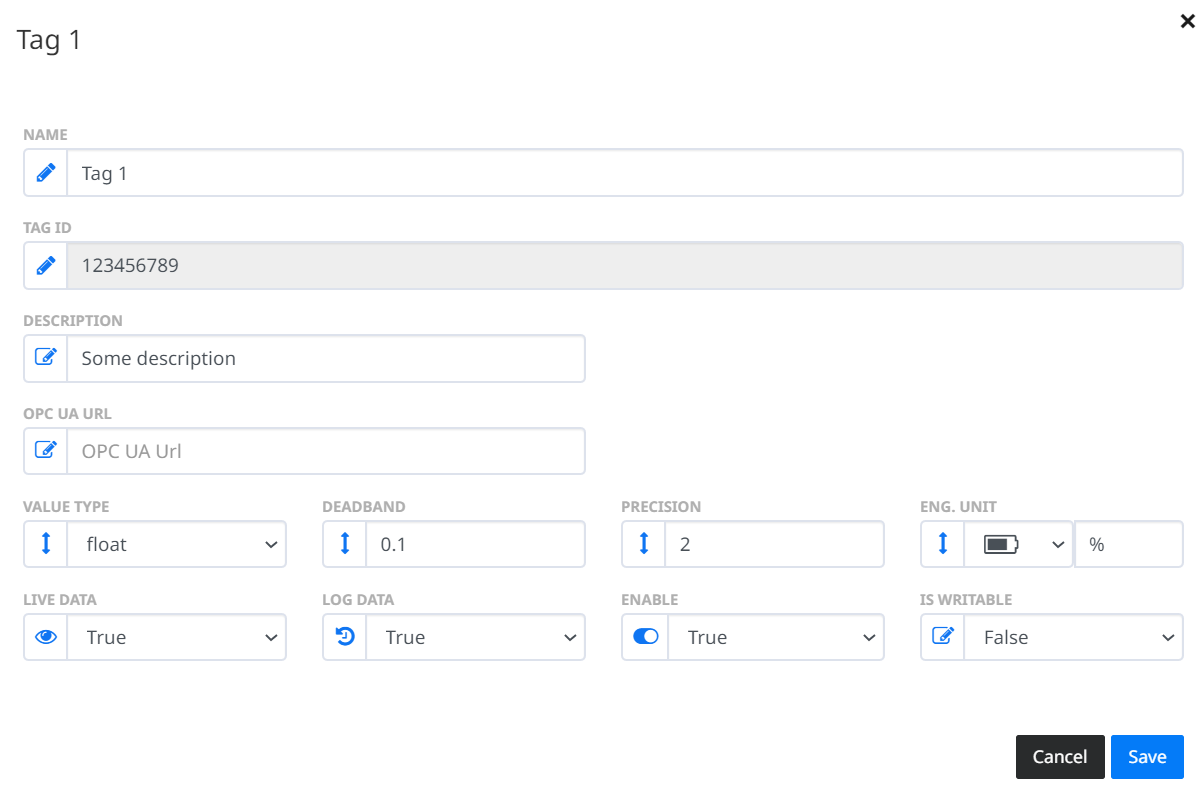
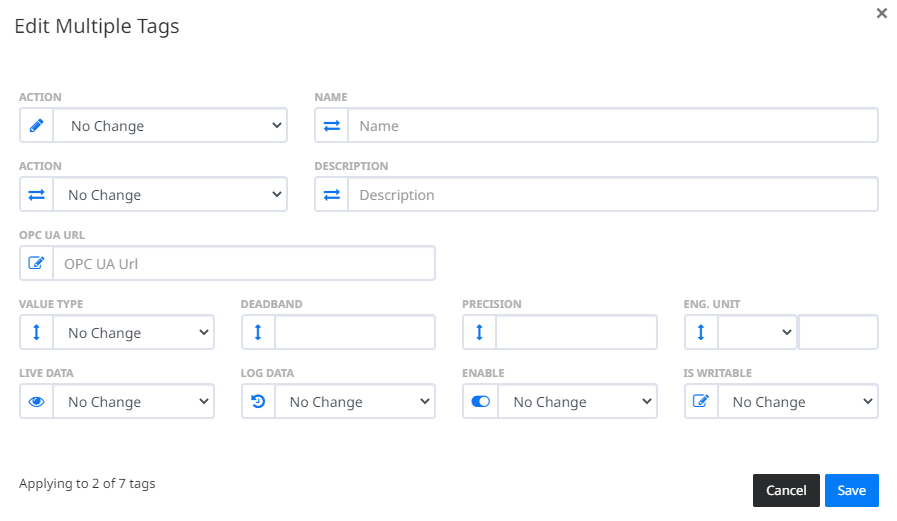
By clicking on the button you can change the Actions for the specific Tag listed in the table, upon which an “Edit tag” form appears. Also, by selecting multiple Tags and clicking on the  button you can apply changes to all the selected Tags.
By clicking on the
button you can apply changes to all the selected Tags.
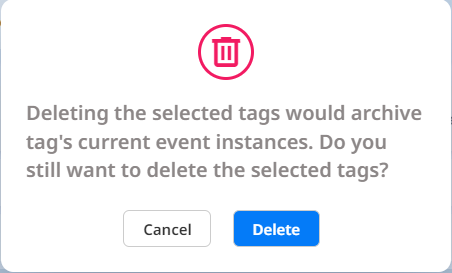
By clicking on the  button you can delete the specific Tag listed in the table, upon which an “Confirm” form appears. Also, by selecting multiple Tags and clicking ont the
  button you can apply changes to all the selected Tags.
By clicking “Back” button  you can go back to the Endpoints view.
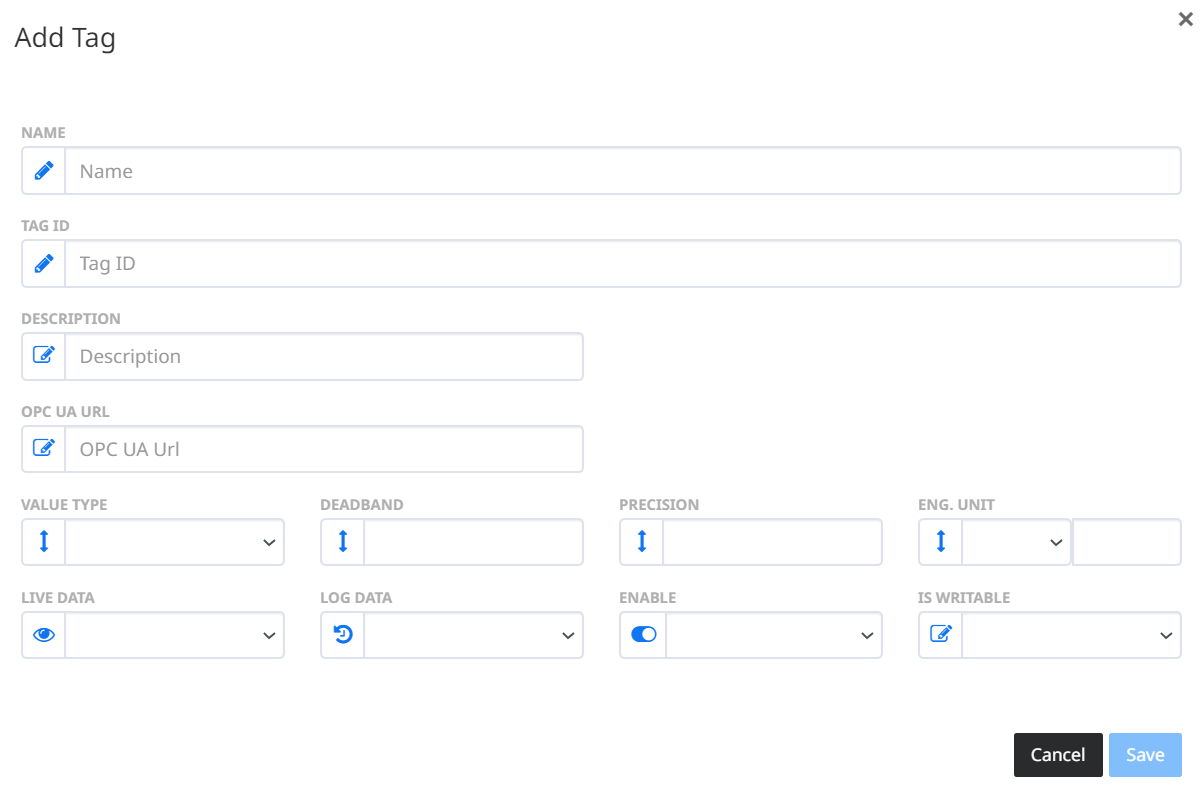
The User can add a new Tag by clicking on the  button, upon which an “Add tag” form appears which requires information to be provided.
‘Deadband’ and ‘Precision’ input fields are visible only for tag of int, float and string value type. For boolean value type tags instead of ‘Deadband’ and ‘Precision’, there are fields for ‘State true’ and ‘State false’.
button, upon which an “Add tag” form appears which requires information to be provided.
‘Deadband’ and ‘Precision’ input fields are visible only for tag of int, float and string value type. For boolean value type tags instead of ‘Deadband’ and ‘Precision’, there are fields for ‘State true’ and ‘State false’.
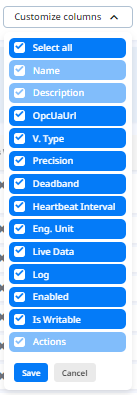
You should select which columns you want to see in the table using the button  The “Details”, “Name” and “Actions” are default columns and cannot be hidden.
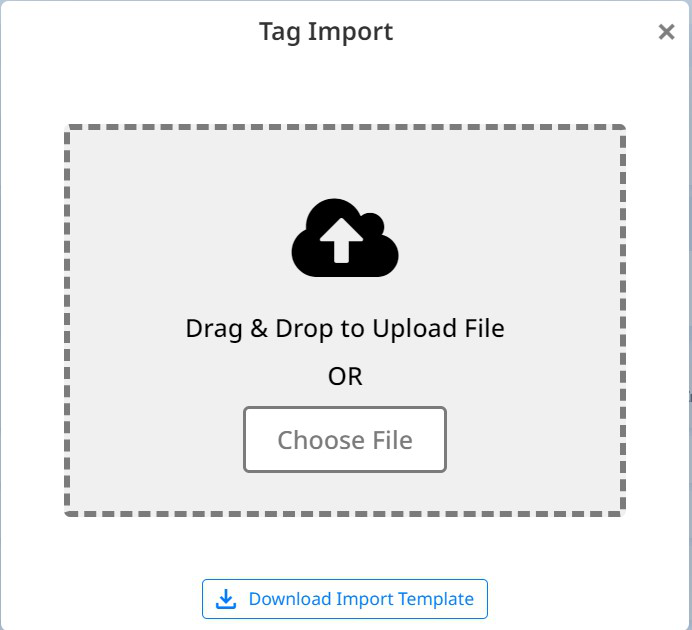
The User (Super Admin) can add a multiple Tags by clicking on the  button, than on Import Tags
 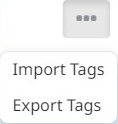 upon which an “Tags Importing” form appears which have a template and downloading it user should add a multiple tags using excel file. In the excel file for string and boolean value type are not required ‘Deadband’ and ‘Precision’. The ‘Engineering Unit’ and ‘Engineering Icon’ are not required for all value types and also ‘StateTrue’ and ‘StateFalse’ are required only for boolean value type. While importing tags are in progress user should see a progress bar and when importing is done user should be notified with Success Message.