History
Qlarm keeps all the values your sensors emit and pass them through filter rules to the system. History View displays the list of these values. They are filtered by Tag. Because of the amount of the data provided, data can be presented grouped by hour or by day and the samples for the time chunks will be a result of the function you select. You can also choose to list the data in certain period of time. You can export listed data in CSV or XLSX files.
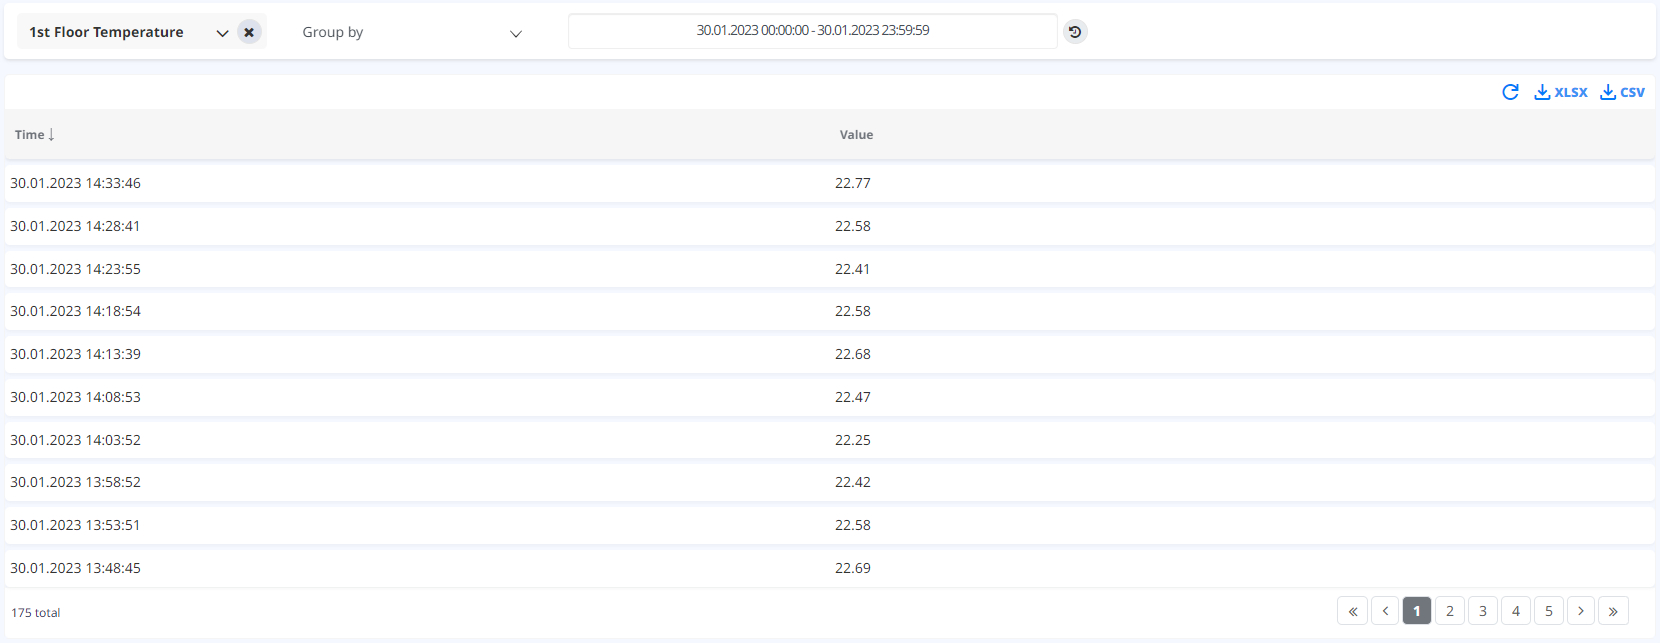
By selecting a Tag from the searchable drop-down Tag list, the table is filled with all the information associated with that Tag. The table displays the time and value for each line of information. f values, minimum, maximum, average and standard deviation value of the Value column. This table can be refreshed to update its content and downloaded in .xlsx or .csv format.
In addition to the default “Tag” filter, used to select a Tag to show its content in the table, there is a “Group By” and “Time” filter. The “Group By” filter is used to group the table content by Hour or Day. This filter is accompanied with a “Function” filter which allows us to select which statistical information to be calculated for our grouped content.

You (as a Super Admin) can also view the differences between two values in custom time period with click on  button. You can select up to 10 tags, time period and when the filters are populated, after click on “Calculate” button you can see the differences:
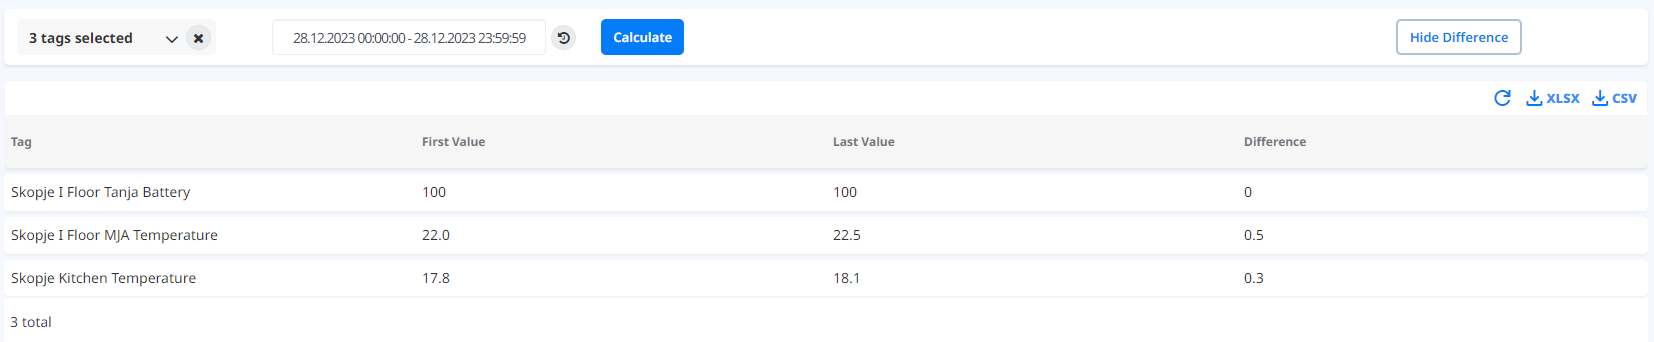
The table displays the tag name, first and last value and the difference for each of the selected tags. This table can be refreshed to update its content and downloaded in .xlsx or .csv format.